Examination of draining vein contributions in GE- and SE-EPI BOLD across cortical depth at 7 T
Functional magnetic resonance imaging (fMRI) at ultra-high magnetic field strength (≥ 7 T) bears the potential to study laminar and columnar features of the human brain in vivo (Yacoub et al., 2007, Neuroimage, 37, 4, 1161–77). However, gradient-echo based sequences (GE-BOLD), which are most often used for fMRI, lack spatial specificity due to their sensitivity to macrovascular contributions (Polimeni et al., 2010, Neuroimage, 52, 4, 1334–46). Other approaches like the spin echo technique (SE-BOLD) promise higher spatial specificity at the expense of sensitivity (Chaimow et a., 2018, Neuroimage, 164, 32–47).
In our study, we estimated the spatial point spread function (PSF) of high-resolution GE- and SE-BOLD at different cortical depths. The cortical PSF was determined on the basis of induced traveling waves of different spatial frequencies in the primary visual cortex (V1) (Parkes et al., 2005, MRM, 54, 6, 1465–72). All functional data were acquired at 7T with a nominal isotropic voxel size of (0.8 mm)3.
A PSF model was fitted to the magnitude of the Fourier component at stimulation frequency in dependence of the spatial frequency of the induced traveling wave.
Figure 1(a)–(b) shows exemplary phase responses for GE-EPI for runs with 2 and 14 wedges, respectively. Figure 1(c)–(d) show the corresponding responses from SE-BOLD measurements. The same phase distribution is visible for both acquisition techniques. Figure 1(e)–(h) show associated percent signal changes for GE-BOLD (e: 2-wedges, f: 14-wedges) and SE-BOLD (g: 2-wedges, h: 14-wedges). These signal amplitudes were used in combination with the spatial frequencies of induced traveling waves to model the width of the PSF. Responses are visualized on an inflated cortical surface mesh. The white line depicts the V1/V2 border. The dotted white line demarcates the area, which was not covered by SE-BOLD measurements.

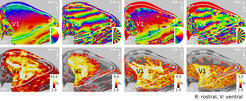

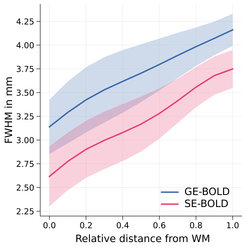
Figure 2 shows the estimated average width of the PSF, which increases going from deeper to higher layers. The width of PSF increases for both GE- and SE-BOLD, which points towards remaining macrovascular draining vein contributions in both acquisition types. Shaded areas indicate the standard error across four participants.
While a recent study analyzed the PSF across cortical depth for GE-BOLD (Fracasso et al., 2021, Prog Neurobiol, 202, 102034), in this study, we show for the first time the PSF of SE-BOLD at 7 T across cortical depth. Our results indicate that high-resolution SE-BOLD suffers from the same unspecific macrovascular contributions but also a lower sensitivity. While we expect that more advanced SE-BOLD acquisition schemes will improve the signal specificity, in standard acquisitions using a 2D single-shot EPI approach, the disadvantages of SE-BOLD outweigh its anticipated advantages.


