Unveiling the organization of the visual cortex using high-resolution fMRI at 7T
High-resolution fMRI with nominal resolutions below 1 mm promise more precise imaging of neural processes in the human brain. However, the measured MR signal is actually based on the hemodynamic response following neural activation which may lead to a spatial mismatch between measured signal and neuronal activity - especially for high resolution acquisitions. The venous side of the cortical vasculature consists of a capillary bed, penetrating intracortical veins and large pial veins on top of the cortical surface. Whereas the capillary bed is in close proximity to the neuronal activity, signal contributions from larger veins can "drain" the obtained signal millimeters away from the actual source of neural activation. Hence, it is desirable in high-resolution fMRI applications to be most sensitive to the capillary bed.
In conventional fMRI, gradient-echo based sequences are normally used. These sequences have a high sensitivity to detect hemodynamic changes but lack specificity since the signal is largely weighted by veins. Alternative methods, e.g. using spin-echo based sequences or exploiting a different contrast like blood-volume or blood-flow weighted measures, promise more specificity to the capillary bed at the expense of less overall sensitivity.
In our project, we aim to compare different high-resolution fMRI strategies at ultra-high magnetic field strengths (7 T and above) to find out their sensitivity to the non-specific large vein compartments. Thereby, we target the mapping of columnar structures in the visual cortex, especially ocular dominance columns (ODC) in the primary visual area (V1) and the stripe architecture in the secondary visual area (V2). Cortical columns are small groups of neurons which share similar features across the cortical depth. By stimulating the whole column, e.g. by probing the physiological response to monocular visual stimulation for ODCs or to color stimulation for stripes in V2 and analyzing the stripe topography across the cortex, we will get further insights about the dependencies of the MR signal to large veins.

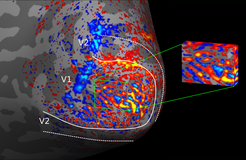
The figure shows ODCs in one participant using a gradient-echo based sequence with nominal isotropic 0.8 mm resolution. Both eyes were separately stimulated in different experimental conditions. The t-score map shows the contrast left eye > right eye. The expected topography of ODCs in V1 can be seen. The experiment was repeated at another day with the same participant which shows an excellent agreement between both measurements.


