High resolution quantitative and functional MRI indicate lower myelination of thin and thick stripes in human secondary visual cortex
In this project, we studied cortical myelin in living humans at the spatial scale of cortical columns using high-resolution quantitative magnetic resonance imaging (MRI) methods at 7 T.
Recent developments in ultra-high field (≥ 7 T) magnetic resonance imaging (MRI) allow the study of columnar features of the human brain non-invasively. E.g., the thin-thick-pale stripe pattern in extrastriate cortex V2 (Tootell et al., 1983, Science, 220, 3498, 737–39) can be delineated with high-resolution functional magnetic resonance imaging (fMRI) (Nasr et al., 2016, J Neurosci, 36, 6, 1841–57). Based on histological studies, these stripes also vary in myelin content although it is still debated which stripe type is more myelinated (Horton et al., 1997, Cereb Cortex, 7, 2, 166–77).
Here, we used quantitative MRI (qMRI) (Weiskopf et al., 2021, Nat Rev Phys, 3, 570–88) in conjunction with fMRI to study myelination differences between stripe types using the longitudinal (R1) relaxation rates (further details reported in (Haenelt et al., eLife 2023)). Four participants were invited to multiple scanning sessions on a 7T MRI scanner over different days. Thin and thick stripes were localized by exploiting their different sensitivity to color and binocular disparity, respectively. All functional data were acquired with a nominal isotropic voxel size of (0.8 mm)3. For qMRI, we used the MPM protocol (Weiskopf et al., 2013, Front Neurosci, 7, 95; Vaculciakova et al., 2022, MRM, 88, 2, 787–801) and acquired data with isotropic 0.5 mm resolution.
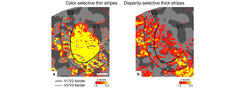
Figure 1 shows exemplary activation maps for thin and thick stripes, respectively. Thin stripes (contrast: color > luminance) and thick stripes (contrast: depth > no depth) are shown as thresholded activation maps in (a) and (b), respectively. Both maps are illustrated on the flattened surface mesh of the right hemisphere for one representative participant showing stimulated portions of V1 and V2. In V2, patchy stripes can be identified, which run through V2 oriented perpendicular to the V1/V2 border. Manually drawn cyan dots mark activated regions in (a) to illustrate the alternating activation pattern between (a) and (b).

Based on the functional definition of these stripes, R1 in thin/thick stripes were compared to the whole V2 excluding the other stripe type (thick/thin) and therefore containing pale stripe contributions, which is shown in Figure 2.

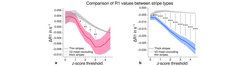
Cortical R1 values in thin stripes (red), thick stripes (blue), and whole V2 excluding the other stripe type (gray; and therefore containing contributions from pale stripes) are shown for various z-score threshold levels, which were used to define thin and thick stripe ROIs based on fMRI. Quantitative parameters are plotted as deviation from the mean within V2 after removing variance from local curvature. Statistical significance was assessed by permutation testing. R1 in thin/thick stripes was lower than surrounding gray matter, which points towards heavier myelination of pale stripes. Shaded areas indicate one standard deviation of the generated null distribution used for permutation testing.
To the best of our knowledge, this is the first study, which shows myelination differences using qMRI at the spatial scale of columnar systems in the living human brain.


